| The LogicPort's user interface has been designed for maximum data viewing area. This is one of the major advantages of PC-based test instruments over conventional stand-alone test equipment.
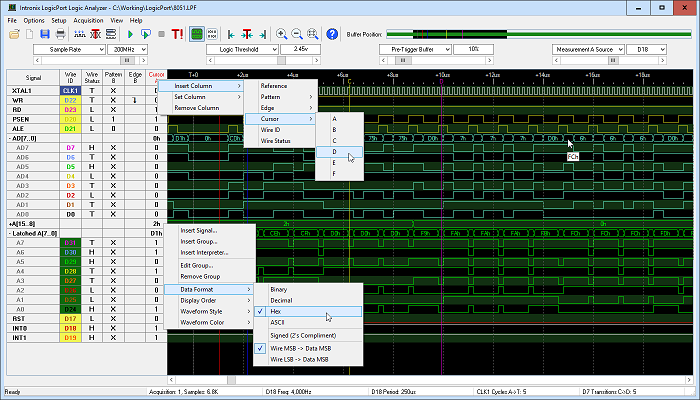
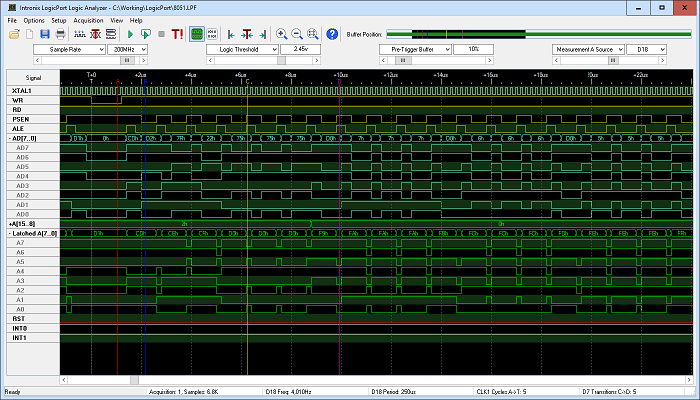
This image shows a few of the 10 different columns which can be included in the waveform display. Trigger patterns and edges are specified by clicking appropriate cells in the table. Colors in the Wire ID column match the color-coded probe supplied with the LogicPort. A Wire Status column is available to show the real-time status of inputs regardless of sample mode or rate. With a couple of mouse clicks you can temporarily hide the columns to get a full-screen view of the acquired data
as shown below.
Groups of signals can be shown as composite waveforms with data annotated in a selectable format. A group of digital signals can also be shown as a signed or unsigned analog waveform. The open menu shows some of the data formatting options available. This menu was opened by right-clicking on a group in the waveform table. The software includes numerous context-sensitive menus providing convenient access to commonly used features.
Interpreters are included for several common protocols.
Transactions using these protocols can
be translated, and the resulting
high-level data displayed along with the
acquired waveforms. |